In NAGA’s Q4 2026 Market Outlook, Market Analyst Frank Walbaum gives a risk-off environment a 50% probability. Here he sets out how a sell-off could travel across asset classes this quarter — and what that path usually means for volatility and trading activity.
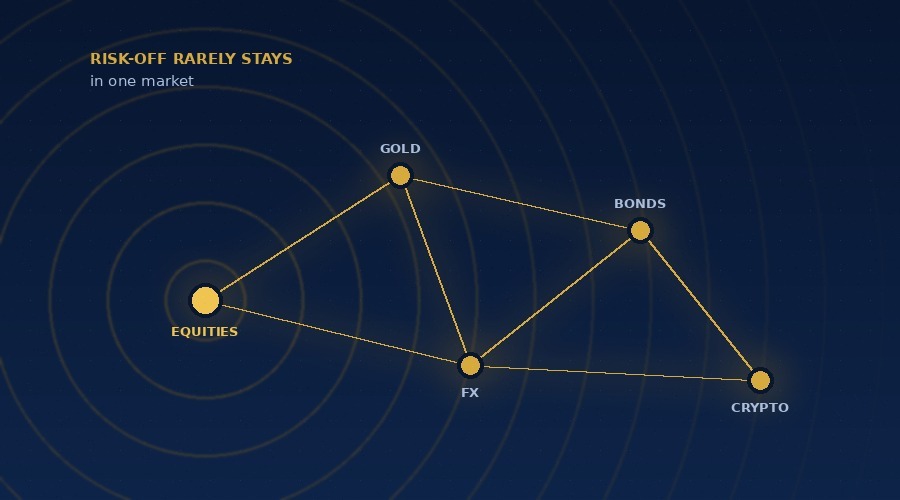
When I put a 50% probability on a risk-off environment in NAGA’s Q4 2026 Market Outlook, it was the most likely of my three scenarios for the quarter — likely, not certain. Risk-off is not a forecast for a crash. It describes how markets behave when confidence breaks, and if it does take hold, the useful questions are about how it travels: which market cracks first, how the move spreads, and what it does to volatility and trading activity along the way.
The starting point explains why I take it seriously. Q4 opened with US indices at record highs, but the rally is narrow. The S&P 500 gained 2.6% in the third quarter while the Russell 2000 fell 7.0%, and only 46% of S&P 500 members traded above their 200-day average in early October, down from about 70% at the end of July. Meanwhile, the Federal Reserve hiked for the first time since 2023; the US 10-year yield rose 85 basis points to 5.29%, its largest quarterly increase since 2009, and Brent crude traded around $100. Strong on the surface, fragile underneath: that is the kind of market in which a sell-off rarely stays where it starts.
Where It Could Start
Three triggers stand out on the Outlook’s risk radar. The first is the AI earnings cycle. Microsoft, Alphabet, Meta and Amazon are expected to report on 28–29 October and Nvidia on 17–18 November, and with so few stocks carrying the index, a disappointment from a handful of names can do more damage than it would in a broad market. The second is the bond market: a 10-year yield pushing well above 5% would raise the discount rate on every equity valuation. The third is the Gulf, where the conflict around the Strait of Hormuz has already taken Brent as high as about $126 this year. Among currencies, a further Japanese intervention in the yen is, in my view, the most likely shock of the quarter.
How It Would Spread
If one of these triggers fires, I would expect the move to travel through a handful of familiar channels. The order depends on the trigger: an AI disappointment would start in equities; a yen move in currencies; and an escalation in the Gulf in oil — and crypto may react before any of them.
-
Equities. Narrow leadership means concentrated selling: the stocks that carried the index would carry the decline. Small caps are already under pressure, and Europe looks more exposed still. The DAX gained only 2.8% in the first nine months of the year and is more sensitive to energy costs if the winter is cold.
-
The dash for liquidity. In a sharp sell-off, investors often cut positions across asset classes — gold included — before safe-haven demand takes over. It happened in March 2020, when gold had its worst week since 1983 as investors sold it to cover margin calls elsewhere. In early October, gold traded roughly 26% below its January record near $5,600, and $4,000 is the line I watch for the long-term uptrend.
-
Currencies. In my base case, the dollar is an important beneficiary of a risk-off quarter. The yen is the wild card. In August 2024, a Bank of Japan rate hike and a weak US jobs report forced investors out of yen-funded carry trades: the Nikkei fell more than 12% on 5 August, its worst day since 1987, and the VIX jumped 180% to almost 66 before the US open. This July, USD/JPY reached 163.99 before Japan intervened, joined by the US in the first joint intervention to support the yen since 1998. Around 160, a fast move in the yen is how a local event becomes a global one.
-
Bonds may not cushion the fall. Since 2022, stocks and bonds have often fallen together when inflation is the problem; in 2022 itself, both US stocks and Treasury bonds suffered heavy losses. With headline PCE inflation at 3.4% and a Fed still hiking, a sell-off driven by yields would find little relief in Treasuries. One driven by growth fears — September payrolls rose by only 29,000 — could. That distinction will help shape whether a risk-off episode is short and sharp or slow and grinding.
-
Crypto at the edge. Bitcoin gained 42.7% in Q3, its best quarter in more than two years, and most major tokens look overbought. Crypto sits firmly on the risk-on side of the dollar story, so it is likely to be among the first markets to react, in either direction. $81,000 is the level that frames Bitcoin’s uptrend.
What Happens to Volatility
In Q3, the biggest moves came in bonds, oil and crypto, while the Cboe Volatility Index closed at 14.21 on 22 September, its lowest close of the year through September. A broad risk-off episode can end that divergence. Co-movement among risky assets tends to increase and equity volatility can catch up quickly, while bonds, gold and currencies respond differently depending on the catalyst. Gauges can also overshoot: the Bank for International Settlements found that dealers’ quote-setting and wider bid-ask spreads in options before the US open contributed to the record August 2024 VIX spike. The practical lesson is to read volatility across markets, not from a single index.
What It Means for Trading Activity
For brokers and active traders, the shape of a risk-off episode matters as much as its size. Sharp, cross-asset shocks tend to bring activity in waves. In April 2025, the month of the US tariff shock, CME Group reported what was then a record 35.9 million contracts a day, up 36% on a year earlier, with records in equity index and metals products. Slow, grinding declines tend to wear retail activity down instead, as 2022 showed.
A NAGA review of seven listed brokers’ public trading-activity and client-revenue measures points the same way: readings were broadly above their trailing averages during the 2020 crash and the April 2025 tariff episode, but more mixed in the first half of 2022. In 2026, the two groups ran on different cycles: in the first quarter, the CFD-led brokers’ measures ran almost 40% above their trailing averages, against about 17% at the US retail platforms; in the second quarter, which brought a rally and the SpaceX listing, the roles reversed — the platforms ran a third above their averages while the CFD-led brokers slipped just below theirs.
Q3 indicators are preliminary: reporting periods differ, several monthly observations cover July–August only, and the CFD-led sample includes a company estimate. The comparison illustrates why a single equity-volatility gauge is not a complete proxy for these brokers’ trading-activity and client-revenue measures.
Positioning is the other variable. On 30 September, NAGA clients leaned long in four of the most actively traded markets on the platform, led by oil at 55.62% long, while gold was almost balanced at 51.54% — a modest net-long tilt, not an extreme positioning signal. Long-short shares say little about leverage, so on their own they are not evidence of how a sell-off would unfold. My own judgement, given how different the possible triggers are, is that a risk-off this quarter would more likely come in stages than as a single shock.
For trading businesses, a spreading risk-off is a test of operations as much as of markets: margin and liquidity across several asset classes at once, weekend gaps in oil, and clear communication with clients about leverage when volatility jumps.
What I Am Watching
The AI earnings window at the end of October is the most immediate test. Beyond that, the 10-year yield relative to 5%, any joint currency intervention, and the trajectory of oil near the Strait of Hormuz are the signals most likely to determine whether Q4 stays resilient or whether the fragility beneath the surface becomes the story. A risk-off environment rarely announces itself cleanly — it tends to start in one corner of the market and only reveals its full reach once it is already moving.